
Information is useless without comprehension. It is a tree falling in the woods. What is a million-dollar insight worth if it is buried in a sea of numbers?
With every analytics process, there is the opportunity for great data visualization. Going from “good” to “great” requires a leap of creativity that meaningly conveys trends or highlights important outliers.
We consider great visualization to be more than a plug-in chart; it is a craft that is informed by the characteristics of the information and the people involved.
Stock market clustering
The above video represents a method we developed for automated market clustering. Individual stocks are compared to each other to find the similarity between them. Here similarity was taken to be the Euclidian distance in daily price movements over the past year. The idea being that similar stocks will tend to move in similar ways. These similarity scores were put into a NxN relationship matrix that was reduced to two dimensions via the singular value decomposition (SVD). Thus stocks that tend to move similarly are positioned closely.
Stock Auralization
People look at stock data in the form of charts all of the time. It is one of the primary ways for people to assess trends. What if our audio cortex can detect patterns that would not stand out visual cortex?
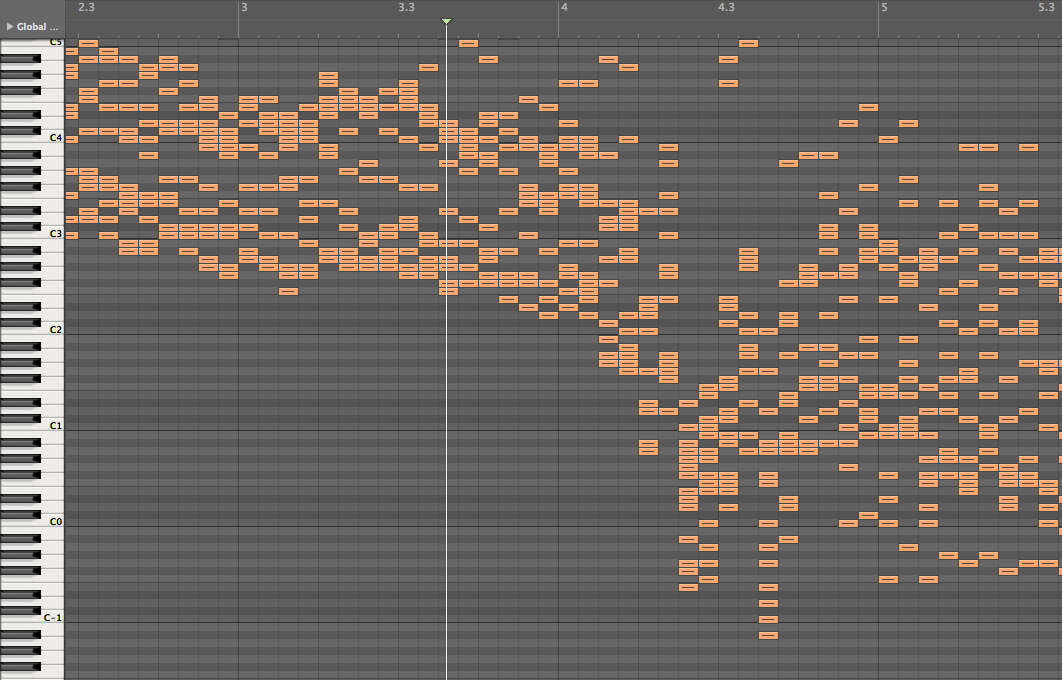
To demonstrate what stock data would look “auralized”, we have converted about two months of trading data for the S&P100 into an audio recording using a proprietary method. This wasn’t an ordinary two months; these are the days leading up to and, and then following, Black Monday — one of the darkest trading periods in US history.
At the beginning of the piece you can hear the stocks flying high. They seem to warble a bit and then, suddenly, they plunge into baritone. One stock you will hear recovers rather quickly; the rest are mired in panic. When listening, keep in mind that this is 100 “voices”; it is reminiscent of the shaped cacophony of the monolith theme from 2001:
Listen to: Black Monday
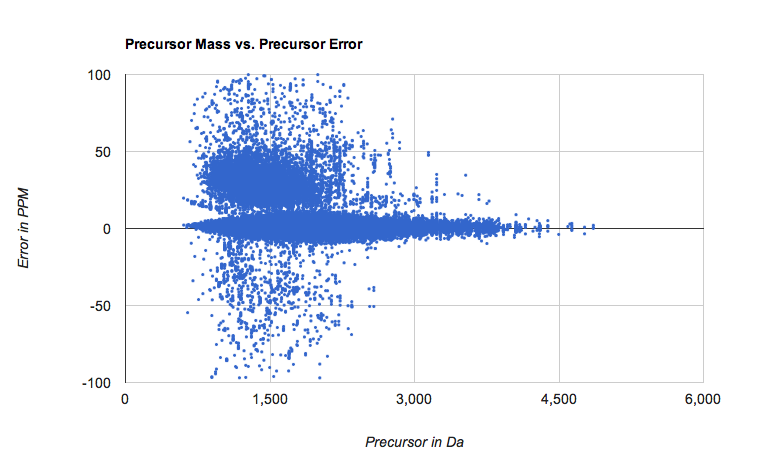
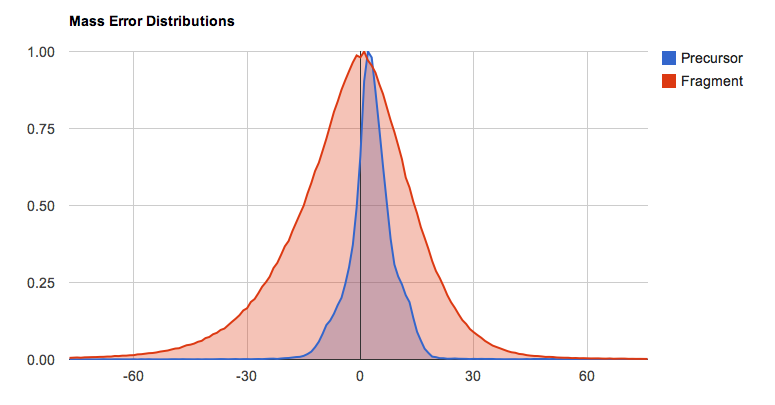
Proteomic accuracy analysis
Here we have taken peptide/spectrum matches (PSM) identified with Peppy at the 1%FDR. Using custom software we have determined not only the precursor mass error for each PSM, we have determined the fragment error.
Leave a Reply