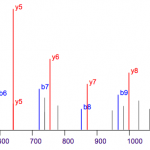
The following is a tool that visualizes a MS/MS spectrum and automatically highlights the b and y-ions. The highlighting is accomplished by taking an amino acid sequence you supply. The software then creates a theoretical spectrum and highlights all peaks that fall within a given mass-tolerance of theoretical peaks.
Upload a DTA to visualize the spectrum. Specify a peptide sequence to highlight the b and y-ions.


Leave a Reply